Looking for a Sainte-Laguë calculator? Try here.

This work is licensed under a Creative Commons Attribution-NonCommercial-ShareAlike 4.0 International License, which allows you to share and adapt the material for non-commercial purposes as long as attribution is provided and that the same license applies to your work.
Proportional representation is a great thing, because it allows political parties to have a fairer share of seats in a parliament/assembly/council in relation to their share of the vote rather than the rather unfair share of seats usually given by FPTP.
The only problem is that it’s often hard to calculate. The most common form is the D’Hondt method, by which seats are awarded in rounds to the party with the highest votes to seats ratio at the time. The co-efficient for this is calculated with this formula:
Co-efficient = Votes / (Seats already earned + 1)
Doing this over and over again to award each seat is a tricky and time-consuming process and, although perhaps better for understanding, isn’t ideal if you are looking to find results quickly. There are online calculators and Excel calculators out there, but most need to be paid for and are difficult to use.
However, I’ve built a simpler D’Hondt calculator for Microsoft Excel that can calculate the number of seats to be awarded to up to 6 parties. It can also take into account seats won via FPTP, which is important in doing seat calculations using Mixed-Member Proportional Representation such as the Additional Member System used here in Scotland.
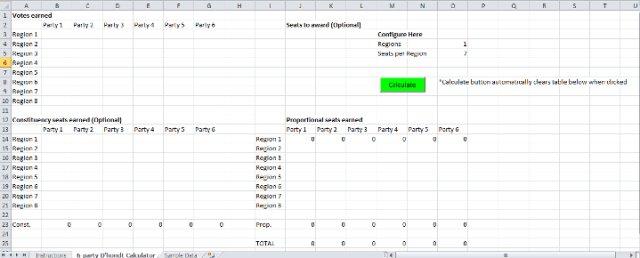
All you need to do is enter the votes earned for each party in each region in the top left, configure the number of regions and seats awarded per region in the top right and then hit the Calculate button, which will automatically fill the table showing the number of proportional seats due. If you are just using a simple D’Hondt method you will only need to use one region. You can even enter the names of the parties and regions in the top left and it will replicate across to the other sections of the worksheet, which is useful if you plan on copying the data elsewhere. Here’s a screenshot of the workbook below:
There are further instructions inside the workbook on what to do. I’ve left the workbook open so that it’s entirely free to edit, and if you can use the VBA programming language you can edit the code and make amendments as you see fit. I’ve left as many comments within the code as possible to explain what everything does. If something goes wrong while using the Calculator, just download it again.
Just click here to download the D’Hondt Calculator (in Microsoft Excel Macro-Enabled format).
You can also check out the Sainte-Laguë calculator, which allows you to calculate proportional representation with another method.
If you have any suggested improvements or amendments to the calculator to suggest, feel free to leave a comment below.
Has this resource been helpful to you? It would be greatly appreciated if you could donate a couple of dollars to keep the site up and running!
UPDATE: 7th January 2015 – A recent Excel update has meant that for some users ActiveX buttons (such as the calculate button in this workbook) do not work as expected. Instructions on how to fix this error can be found here.
UPDATE: 8th September 2015 – The calculator now features the ability to award different numbers of seats per region (thanks to Ez for the suggestion!)
UPDATE: 27th March 2016 – You can now choose between a 6-party and a 10-party worksheet, making it easier to do calculations for larger party systems (thanks to Si for the suggestion!)
UPDATE: 5th June 2016 – You can now set a threshold for earning proportional seats
UPDATE: 15th June 2017 – You can now download a 12-party version of the calculator here https://www.stevenkellow.com/D’Hondt%20Proportional%20Calculator-v6.xlsm
UPDATE: 14th April 2019 – Some code improvements have been made and the 12-party/6-party version of the calculator is now the default
UPDATE: 14th May 2021 – Fixed some logic errors for calculating seats with a threshold
Hi,
I have a question about this calculator. Is it possible to make the number of seats from the region vary? From what I saw in the excel sheet, it is fixed to 7 for all regions.
Hi there,
Thanks very much for getting in touch!
That wasn’t something the calculator could do previously but I’ve made a few changes to the code and you can now award different numbers of seats per region. I’ve updated the file so if you download it again it should work, let me know if you have any more questions!
How can I make it for 15 parties?? Thanks
Hi Veysel,
You should be able to add the columns into the spreadsheet and then update the source code in Developer tab > Source code. You’ll need to update the cell references that are 12 apart to being 15 apart.
Helo Steven Pellow
I am writing a Bachelor thesis about what composition of the EU Parliament would result if uniform voting rules had been applied for the legislative term of 2014 until now. In order to be able to use your calculator I would have to be able to enter more parties, up to at least 10 if not more. Is there any chance that you could modify the code so that more parties can be included in the calculation?
Thank you and
Regards Si
Hi there Si,
That’s a great idea, thanks very much for the suggestion!
I’ve updated the file now so you can choose between a 6-party worksheet and a 10-party one, hope that works for you. Let me know if there’s any more I can do.
Best of luck with your thesis!
Regards,
Steven
I want to see the formula that it is used for allocation of seats
Hey M,
Here’s the VBA code that runs when you hit the Calculate button, let me know if you need any more information!
Dim seatsAward As Integer ' The number of seats to award for each regionDim seatsIncrement As Integer ' A counter that checks each region's seat award
Dim max As Double ' The maximum coefficient to determine which party wins the seat
Dim votes(0 To 5) As Double ' The array storing votes, set to a double so that predictions with decimals can be used
Dim seats(0 To 5) As Integer ' The array storing seats already earned
Dim coeff(0 To 5) As Double ' The array storing the coefficients
Dim awarded(0 To 5) As Double ' The array storing the number of proportional seats awarded
Dim row, regions As Integer ' Setting the row used for locational purposes and the number of regions to be used
Range("$J$14:$O$21").Clear ' Clears the proportional seats awarded in case there's already data
regions = Cells(4, 15).Value ' Gets the number of regions from cell O4
row = 14 ' Sets the row location for getting other data
seatsIncrement = 3
For region = 1 To regions ' A loop that runs for each region
seatsAward = Cells(seatsIncrement, 9).Value ' Gets the number of seats to award per region from column I
If seatsAward < 1 Then ' Conditional loop to use default from cell O5 if not specific one chosen seatsAward = Cells(5, 15).Value End If seatsIncrement = seatsIncrement + 1 votes(0) = Cells((row - 11), 2).Value ' Gets the number of votes for the first party votes(1) = Cells((row - 11), 3).Value votes(2) = Cells((row - 11), 4).Value votes(3) = Cells((row - 11), 5).Value votes(4) = Cells((row - 11), 6).Value votes(5) = Cells((row - 11), 7).Value For Validate = 0 To 5 ' If there are no votes then sets the votes to 1, so that there's no errors - will not affect seats unless votes are extremely low If votes(Validate) < 1 Then votes(Validate) = 1 End If Next seats(0) = Cells(row, 2).Value ' Gets the number of seats already earned by a party for Mixed-Member or Additional member systems seats(1) = Cells(row, 3).Value seats(2) = Cells(row, 4).Value seats(3) = Cells(row, 5).Value seats(4) = Cells(row, 6).Value seats(5) = Cells(row, 7).Value For counter = 0 To 5 ' A loop that calculates each party's coefficient coeff(counter) = votes(counter) / (seats(counter) + 1) Next For awardcounter = 1 To seatsAward ' A loop that awards the number of seats available for each region max = 0 ' Sets the max to 0 to start the loop For coeffcounter = 0 To 5 ' A loop for each party to check if it has the maximum coefficient If coeff(coeffcounter) > max Then
max = coeff(coeffcounter)
End If
Next
For seatcounter = 0 To 5 ' A loop that increments the number of seats awarded
If max = coeff(seatcounter) Then ' If the party has the largest co-efficient add a seat
awarded(seatcounter) = awarded(seatcounter) + 1
coeff(seatcounter) = (votes(seatcounter) / (1 + seats(seatcounter) + awarded(seatcounter))) ' Update the coefficient for the next loop
End If
Next
Next
Cells(row, 10).Value = awarded(0) ' Output the number of seats awarded for this region
Cells(row, 11).Value = awarded(1)
Cells(row, 12).Value = awarded(2)
Cells(row, 13).Value = awarded(3)
Cells(row, 14).Value = awarded(4)
Cells(row, 15).Value = awarded(5)
row = row + 1 ' Move to the next row for the next region
Erase awarded() ' Clear the number of seats awarded to each party as it's irrelevant for the next region
Next ' Continue to the next region
Thank You for showing the code, I do not understand some parts of the code if could explain ?
The part that i don understand are:
Dim votes(0 To 9) As Double ‘
Dim seats(0 To 9) As Integer ‘
Dim coeff(0 To 9) As Double ‘
Dim awarded(0 To 9) As Double
When we declare this variables why you have done 0 To 9,
Then Why
seatsIncrement = 3 why you increment the seats by three?
votes(0) = Cells((row – 11), 2).Value ‘ Gets the number of votes for the first party
votes(1) = Cells((row – 11), 3).Value
votes(2) = Cells((row – 11), 4).Value
votes(3) = Cells((row – 11), 5).Value
votes(4) = Cells((row – 11), 6).Value
votes(5) = Cells((row – 11), 7).Value
votes(6) = Cells((row – 11), 8).Value
votes(7) = Cells((row – 11), 9).Value
votes(8) = Cells((row – 11), 10).Value
votes(9) = Cells((row – 11), 11).Value
This code above as i understand is getting the votes of 10 parties in 8 regions am i Right?
Then the thing that i do not understand is why row-11 and etc
I hope you answer my questions
Sincerely
Thank YOu!
Hey,
The 0 to 9 is to make sure that there’s 10 different parts in the array – most programming languages start with 0 as the first entry.
The seatsincrement variable is just telling the code where the number of seats to award is stored in the spreadsheet, it doesn’t actually increment anything.
You’re right, the votes(x) arrays get the number of votes for each party in a given region, the row-11 bit is again just a way of making sure we’re getting the data for the right part of the spreadsheet.
Hey do you have the code for another method like Sante Lague?
Yeah sure, check out the Webster/Saint-Laguë calculator here.
You are great men, Thanks
Hey , which part of the code has to be changed, if i want to calculate the number of seats instead of having 8 regions to replace it in 1 region, maybe there will be a difference, having one regions instead of having 8 or more or less ?
For example in the one sheets that has with multiple regions in another sheet can you update to use in one region? For the d’Hondt and Webster/Sante Lague Method
What do you think?
Each region is calculated independently of each other, so there’ll be no difference to each region total – but if you’re talking about combining regions into one then there will be a difference. To combine regions save your data in another speadsheet and find the sum of the votes and enter them into one row of the calculator.
If you want to calculate different totals for either of the calculators simply delete the data and start again or save another copy of the spreadsheet 🙂
Hi , there are 12 regions in my country and trying to modify the file , but without success. Can you help me please?
Hi Paul,
I’ve created a 12-party version for you to download here: https://www.stevenkellow.com/D%27Hondt%20Proportional%20Calculator-12party.xlsm
If it’s really helped you out please consider a donation to the PayPal link above, thanks!
Hey Steven!
I find that the 12-party D’Hondt calculator doesn’t perform the calculations for Party 11 and 12.
Just wanted to bring it to your attention.
Regards.
Tobias
Thanks for letting me know, should be fixed now 🙂
Would it be possible to change the number of regions? In particular, I’m thinking of using this to model proportional representation of the American electoral college system (with 51 regions.)
Hi Kari, you’ll be able to use the existing version to calculate the results of any given region/state, and then be able to combine them at the end by keeping a record with them in another sheet. A single-sheet solution like this might be something you would need though if you were looking to award votes nationally as well as for each region, is that something you’d want to do?
Yeah, it’s possible. I’m just trying to figure out how best to handle 51 regions in one shot — without having to copy/paste/copy/paste eight regions at a time every time we want to model different potential election results.
Hi Kari, no problem – I’ve made a copy of the sheet for you here with 51 regions, should hopefully work just the same, let me know what you think!
Thanks!
Great work Steven
Would it be possible to vary/add the votes per region instead of just one total amount, keeping the threshold or even having different thresholds per region? Similar to the way you can have different number of seats per region. So instead o 1 column for number of seats you’d have 3 optional columns. One for seats, one for number of votes, one for threshold.
Thanks a lot for this simple, yet great, spreadsheet
I have 2 questions.
1. Is there a limit for the seats of each region?
2. What if the number of seats are different at each region?
Thanks in advance for the answers.
Hi Mehmet,
There’s no limits for the seats for each region, it can be as high as you’d like. If the number of seats is different between regions you can enter the different numbers in the “Seats to Award (optional)” column and it’ll take that into account.
Hope this helps!
Hi there. Your d’Hondt calculator is fantastic – thanks for making it available.
I was just wondering whether it would be possible to make the excel file so that it displays the number of votes by party in each of the rounds?
Returning the total number of proportional seats gained in each region very quickly is a big help, but it would be very handy to “show the workings” so to speak, in order to see, for example, the number of votes a party was short of gaining a proportional seat. I’ll obviously make a donation for your time!
I’d appreciate any help!
Hi Joe,
Thanks very much for the feedback, it’s much appreciated. That’s a great suggestion and I’ve implemented it now in the latest version of the calculator (v6 – should be able to download from the links in the main post above).
There are now two new sections, one that simply shows at which round each seat was awarded, and then another which shows the coefficients for each round of the calculation (which looks a bit more messy but as good as can be done in Excel).
Hope this assists you but if you have any questions let me know
Hi Steven,
the calculator is brilliant I was about to start work on something similar and was probably going to do this as a Python project (for my own personal development using Python)… but, nah, yours works so well I won’t bother.
That said, would it be possible if I tailored this to an upcoming election using 2016 data (making sure that you are credited with the original work btw) and made a few tweaks, could I forward the altered version to a few people so they can look at scenarios ?
regards,
Ally
Hi Ally,
Thanks very much! I’d be more than happy for you to make use of the calculator in that way, I’ve added a Creative Commons license to the work there to be clear that such use and adaptation is allowed, hope it helps!
Hi Steven
The calculator is very good. I have been using it to do some analysis of UK General Election Results.
I have been trying to use the threshold option, which doesn’t seem to work whatever value I set it to.
Can you explain how to use it?
Hi Mike,
Thanks very much, glad you are finding it useful. I’ve played about with the logic in the code there and the threshold should work more reliably now, if you can download the version from above (should be v7) it should hopefully work!